Example application: quantifying impact using library outputs
Introduction: building on library outputs for domain-specific metrics
Section titled “Introduction: building on library outputs for domain-specific metrics”The library provides core functionalities for time-series analysis: identifying change points and classifying trends in data segments (see Methodology). These outputs serve as foundational elements for domain-specific calculations.
This document presents the framework for calculating two non-additive impact measures in performance marketing, building on temporal segmentation and trend analysis:
actual_overspend_gbp(financial): quantifies overspend due to elevated CPC vs benchmarkengagement_gap_clicks(operational): quantifies lost clicks vs benchmark
These metrics are reported separately and must not be added together. A GBP reference value for engagement_gap_clicks may be shown but is clearly labelled as a reference, not a financial loss.
Statistical fallacies of naive impact models
Section titled “Statistical fallacies of naive impact models”Superficially intuitive approaches to impact calculation often prove inadequate when confronted with non-stationary, complex real-world advertising performance data. Common naive models:
Single fatigue point model
Section titled “Single fatigue point model”Presupposes a single point in time, , after which performance irreversibly degrades. Impact is then calculated relative to a pre-fatigue baseline.
We can express the naive model more cleanly as:
Critique:
Real-world performance rarely exhibits single, monotonic decline. Time series often contain multiple change points, recovery periods, and varying rates of change. Assuming single t_fatigue ignores this complexity and can lead to significant under- or over-estimation of true impact.
Arbitrary benchmark model
Section titled “Arbitrary benchmark model”Compares observed CPC against external or arbitrarily chosen benchmark.
Critique:
Lacks context-specificity. Fails to account for unique performance potential and lifecycle dynamics of individual creative asset.
Implemented framework: benchmarking against sustained optimal performance
Section titled “Implemented framework: benchmarking against sustained optimal performance”The library implements an impact calculation framework that quantifies:
actual_overspend_gbp(financial inefficiency) during periods where CPC exceeds the benchmarkengagement_gap_clicks(operational impact) during periods where CTR falls below the benchmark
These are benchmarked against the creative’s own optimal performance period and are reported separately (not added together).
Financial impact: actual overspend (GBP)
Section titled “Financial impact: actual overspend (GBP)”Step 1: define the benchmark CPC (CPC_benchmark)
Section titled “Step 1: define the benchmark CPC (CPC_benchmark)”Let be the set of temporal segments identified by change point analysis. Define the “good” segments
Let be the longest segment in . Define the benchmark CPC as the average CPC on that segment:
Step 2: identify declining periods (T_decline)
Section titled “Step 2: identify declining periods (T_decline)”Define as all time points within segments classified as .
Step 3: calculate point-in-time actual overspend (actual_overspend_gbp_t)
Section titled “Step 3: calculate point-in-time actual overspend (actual_overspend_gbp_t)”For each , define
Step 4: calculate total actual overspend (actual_overspend_gbp)
Section titled “Step 4: calculate total actual overspend (actual_overspend_gbp)”Operational impact: engagement gap (clicks)
Section titled “Operational impact: engagement gap (clicks)”Step 1: define the benchmark CTR (CTR_benchmark)
Section titled “Step 1: define the benchmark CTR (CTR_benchmark)”Using the same segmentation approach as for CPC, define
Step 2: identify declining periods (T_decline)
Section titled “Step 2: identify declining periods (T_decline)”Define as all time points within segments classified as .
Step 3: calculate point-in-time engagement gap (engagement_gap_clicks_t)
Section titled “Step 3: calculate point-in-time engagement gap (engagement_gap_clicks_t)”For each , define
Step 4: calculate total engagement gap (engagement_gap_clicks)
Section titled “Step 4: calculate total engagement gap (engagement_gap_clicks)”Optionally, a GBP reference value can be derived as:
Data validation and normalisation
Section titled “Data validation and normalisation”Prior to impact calculations, the library performs critical data validation and normalisation steps:
CTR normalisation
Section titled “CTR normalisation”Automatically detects and normalises CTR values stored as percentages rather than fractions. For example, if CTR values are stored as 0.37 (representing 37%) instead of 0.0037 (representing 0.37%), the system normalises these values by dividing by 100. Prevents impossibly high CTR benchmarks and ensures accurate impact calculations.
Visualisation and interpretation
Section titled “Visualisation and interpretation”The library generates sophisticated visualisations to help interpret impact analysis results. This section explains how to read and interpret these plots.
Enhanced individual metric analysis
Section titled “Enhanced individual metric analysis”Generates enhanced two-panel plots for each metric (CPC or CTR) with impact analysis overlays.
Top panel: time series with impact context
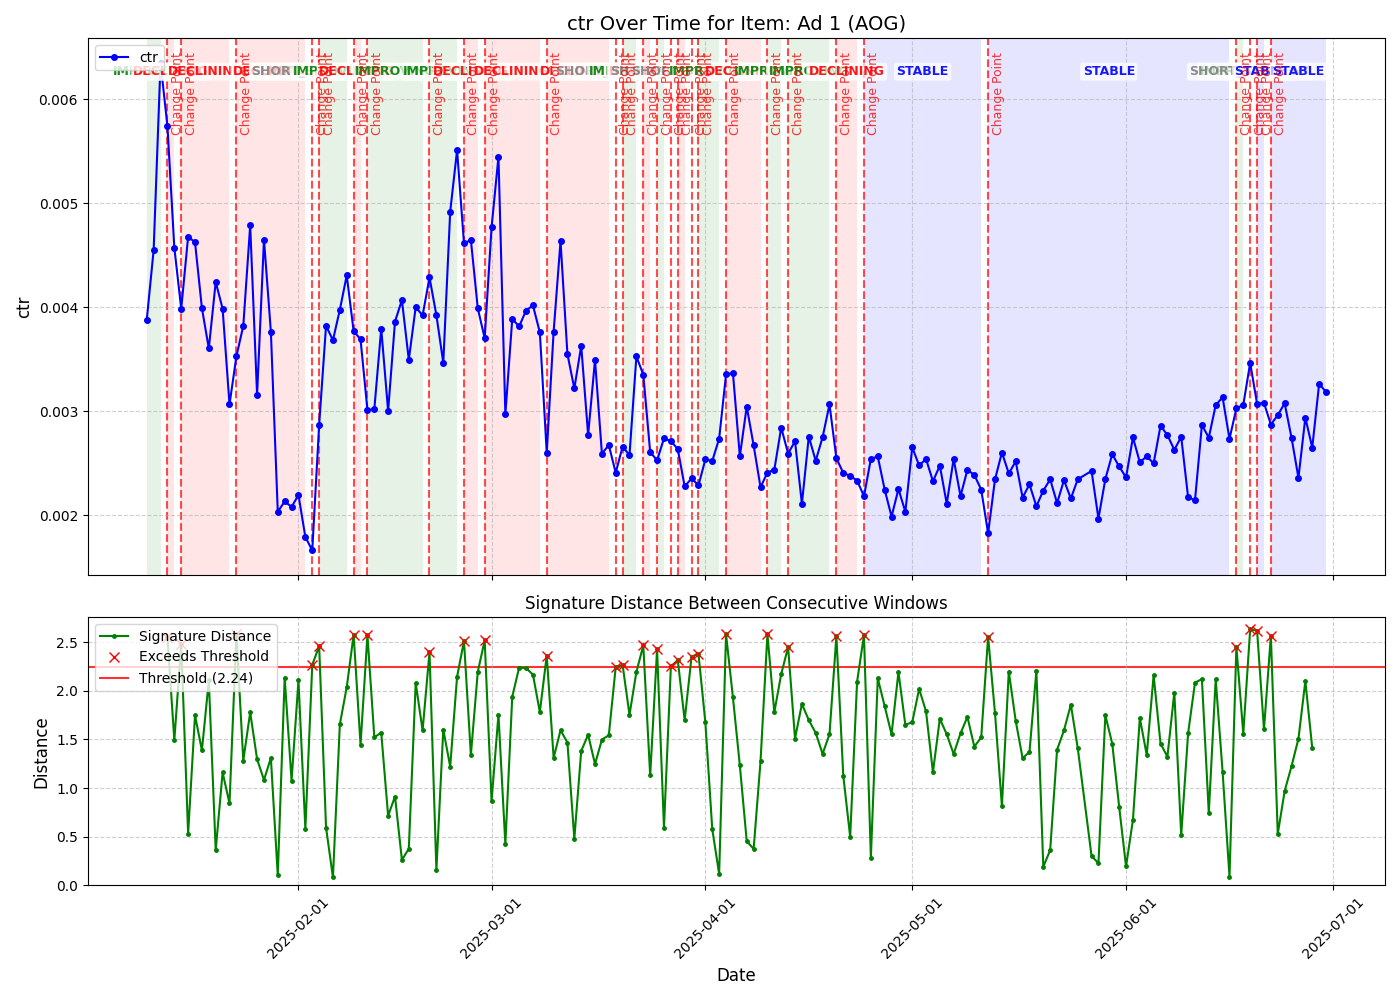
Section titled “Top panel: time series with impact context”Displays primary metric over time with key analytical overlays:
Time series line (blue)
- Shows the actual CTR values over the analysis period
- Connected points indicate daily performance measurements
- Fluctuations reveal natural variation and trend changes
Benchmark line (green dashed)
- Horizontal line representing the calculated benchmark value (2.60% in this example)
- Derived from the period of optimal stable performance
- Serves as the reference point for impact calculations
Benchmark period highlighting (light blue shaded area)
- Indicates time period used to establish benchmark
- Typically represents longest stable or improving performance segment
- In this example, covers first 7 days when CTR was consistently high
Segment trend labels
- Text annotations showing identified trend classifications
- “STABLE” indicates periods of consistent performance
- “DECLINING” marks periods where performance deteriorates
- Based on signature-based change point detection
Underperformance areas (red shaded regions)
- Highlight periods where actual performance falls below benchmark
- Only shown for declining periods after benchmark period ends
- Area size reflects magnitude of impact (e.g., engagement gap)
- Vertical red lines mark boundaries of impact periods
Change points (red vertical lines)
- Mark significant pattern changes detected by signature analysis
- Indicate transitions between different performance phases
- Based on mathematical signature distance calculations
Bottom panel: signature distance analysis
Section titled “Bottom panel: signature distance analysis”Shows sophisticated mathematical analysis underlying change point detection:
Signature distance line (green with dots)
- Each point represents mathematical “distance” between consecutive time windows
- Higher values indicate greater changes in underlying pattern
- Based on rough path theory and signature calculations
Detection threshold (red horizontal line)
- Threshold value (1.708 in this example) for anomaly detection
- When signature distances exceed this threshold, significant changes are flagged
- Automatically calculated based on data characteristics
Anomaly markers (red X)
- Mark time points where signature distances exceeded threshold
- Correspond to change points shown in top panel
- Indicate statistically significant pattern shifts
Impact analysis dashboard
Section titled “Impact analysis dashboard”For detailed analysis, generates a four-panel dashboard summarising operational (clicks) and financial (GBP) impact separately.
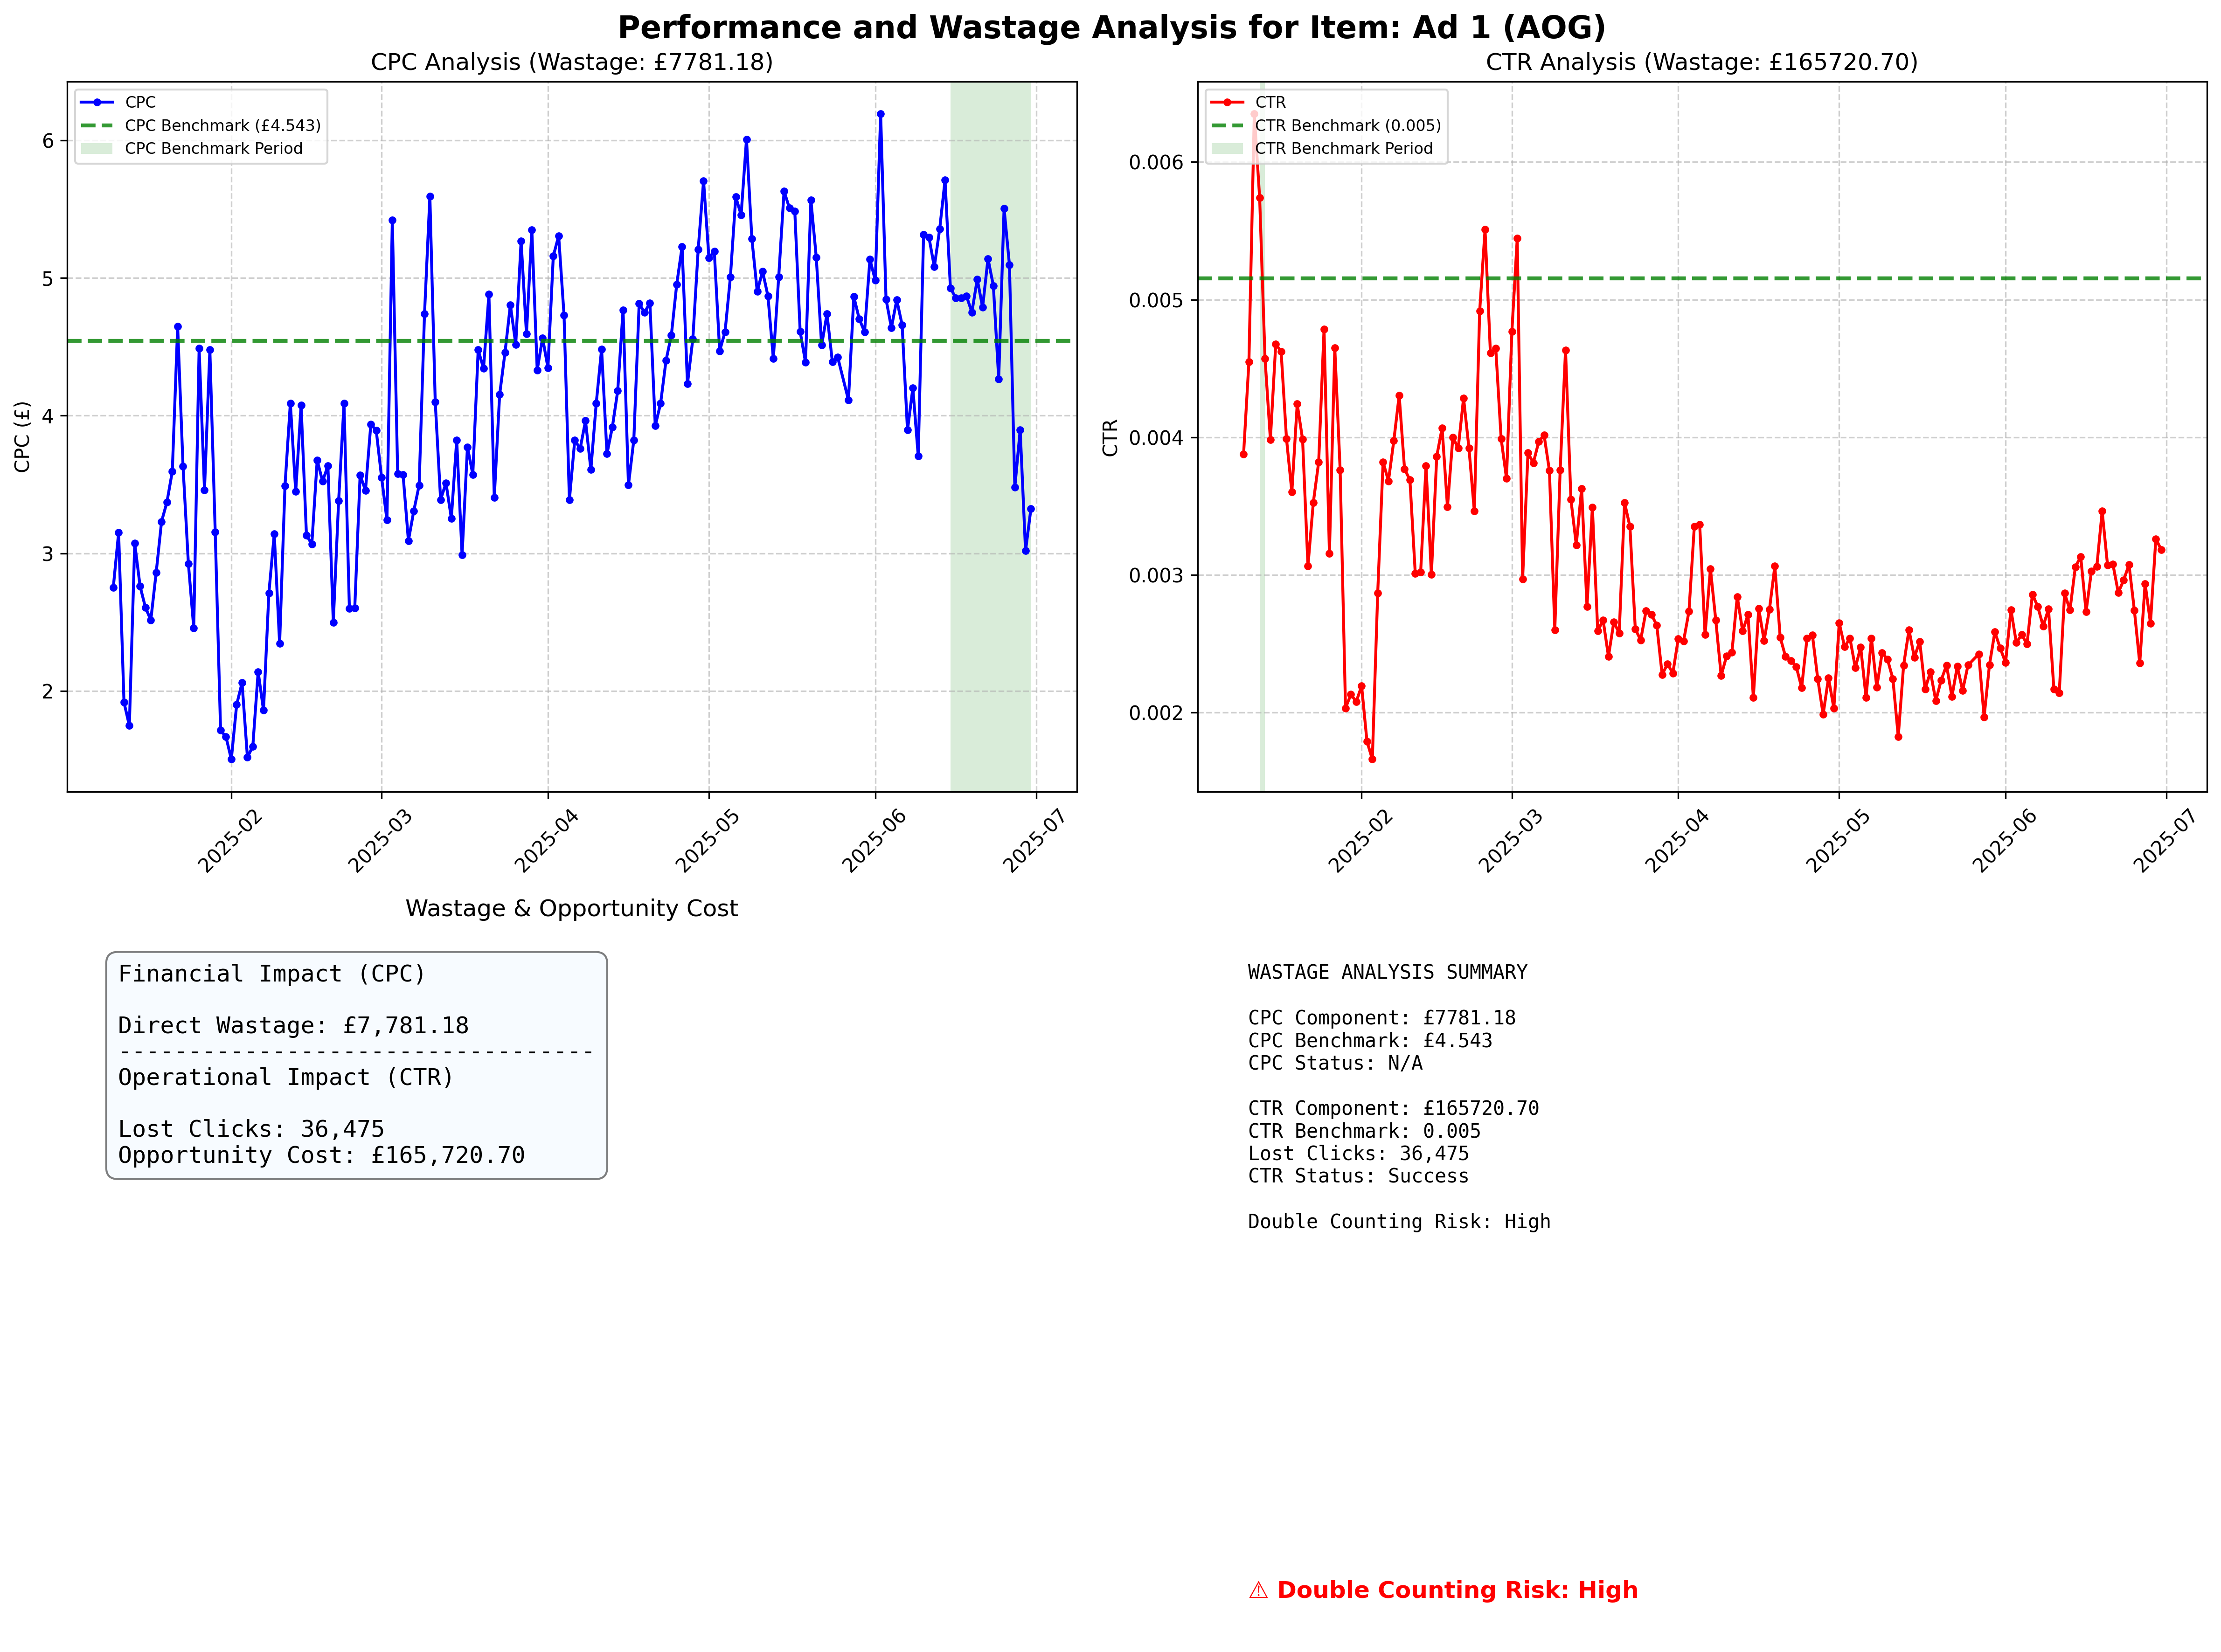
Panel 1: CPC analysis (top left)
Section titled “Panel 1: CPC analysis (top left)”Mirrors individual CPC analysis with:
- CPC time series with benchmark line and impact highlighting
- Segment trend classifications
- Change point markers
- Underperformance area visualisation
Panel 2: CTR analysis (top right)
Section titled “Panel 2: CTR analysis (top right)”Mirrors individual CTR analysis with:
- CTR time series with benchmark line and impact highlighting
- Segment trend classifications
- Change point markers
- Underperformance area visualisation
Panel 3: impact indicators (bottom left)
Section titled “Panel 3: impact indicators (bottom left)”Primary and reference indicators
engagement_gap_clicks(primary): Lost clicks relative to benchmark (operational)actual_overspend_gbp(secondary): Actual overspend relative to benchmark (financial)- Do not add or combine these metrics; they are conceptually distinct
Panel 4: summary and risk assessment (bottom right)
Section titled “Panel 4: summary and risk assessment (bottom right)”Detailed text summary including:
Impact metrics
engagement_gap_clicks(primary)actual_overspend_gbp(secondary, clearly labelled as reference value for GBP when applicable)- Lost clicks due to CTR underperformance (as engagement gap)
Benchmark information
- CPC and CTR benchmark values with calculation periods
- Provides context for impact calculations
Calculation status
- Indicates whether impact calculations were successful
- “Success” confirms reliable benchmark establishment
- “Insufficient Data” or “No Declining Periods” indicate limitations
Correlation risk indicator
- Colour-coded severity levels:
- Low Risk (Green): Weak or positive correlation (r > -0.2)
- Medium Risk (Orange): Moderate negative correlation (-0.5 < r < -0.2)
- High Risk (Red): Strong negative correlation (r < -0.5)
- Unknown Risk (Grey): Insufficient data for correlation analysis
- Metrics are not combined; interpret
engagement_gap_clicksandactual_overspend_gbpseparately regardless of risk level
Interpretation guidelines
Section titled “Interpretation guidelines”Understanding impact magnitude
Section titled “Understanding impact magnitude”Significant impact indicators:
- Large red shaded areas in time series plots
- Substantial gaps between actual performance and benchmark lines
- Large
engagement_gap_clicksand/or notableactual_overspend_gbpmagnitudes
Minimal impact indicators:
- Small or absent red shaded areas
- Performance lines close to benchmark levels
- Low
engagement_gap_clicksand minimalactual_overspend_gbpin the summary panel
Correlation risk considerations
Section titled “Correlation risk considerations”High risk scenarios:
- Strong negative correlation between CPC and CTR (r < -0.5)
- When CTR declines, CPC increases proportionally
- Do not compute any combined total; interpret
engagement_gap_clicksandactual_overspend_gbpseparately
Low risk scenarios:
- Weak or positive correlation between CPC and CTR (r > -0.3)
- Independent variation in both metrics
- Use metrics independently; do not add
Actionable insights
Section titled “Actionable insights”Performance optimisation:
- Focus intervention efforts on periods with large underperformance areas
- Address the metric contributing most to operational or financial impact
- Consider creative refresh at detected change points
Budget planning:
- Use
actual_overspend_gbpfor financial inefficiency assessment - Use
engagement_gap_clicksfor operational impact assessment - Do not compute or use any combined total
Campaign management:
- Monitor signature distances for early warning of performance changes
- Set alerts when distances approach detection thresholds
- Use benchmark periods as performance targets for optimisation
Conclusion
Section titled “Conclusion”This framework provides a data-driven measure of operational and financial impact using temporal segmentation from signature analysis. The detailed visualisation suite enables both technical analysis and business decision-making by clearly presenting complex mathematical insights in accessible format without conflating distinct concepts.